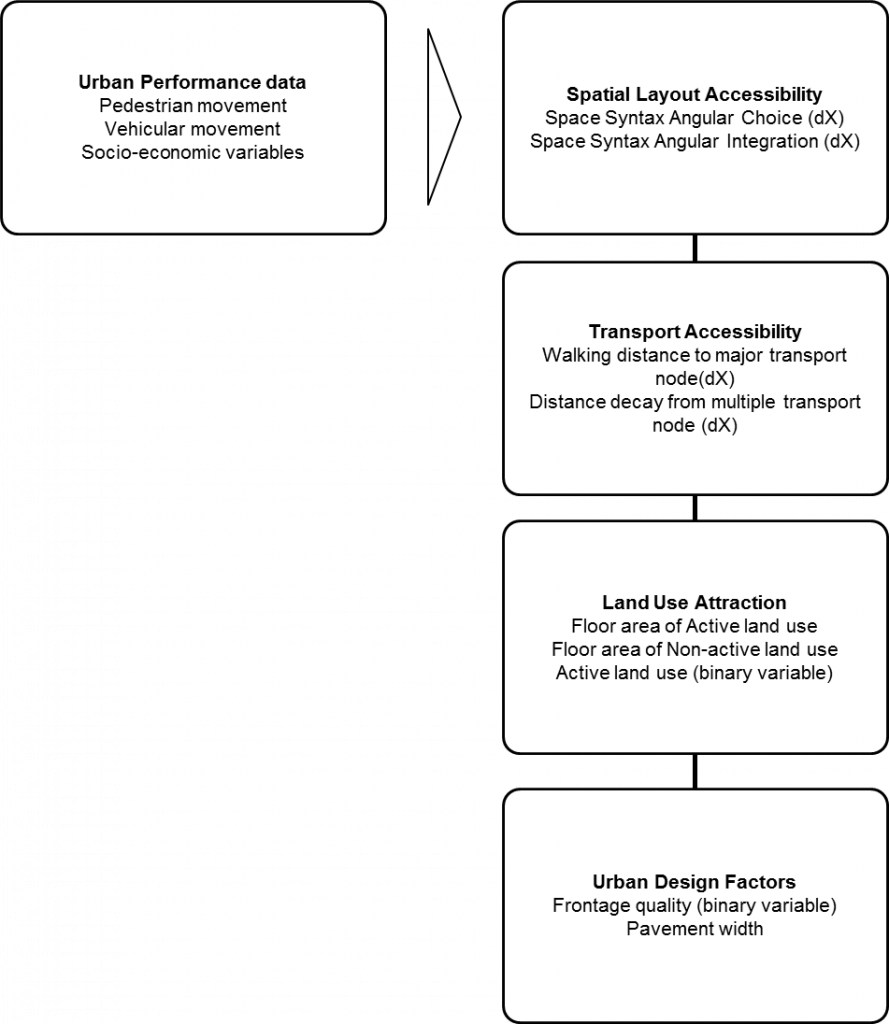
The following section illustrates the construction of the urban performance model in JMP. A
Data Preparation
- File -> Open -> “segment.tab“
- Export segment table as csv
- Tables -> export -> “segment.csv“
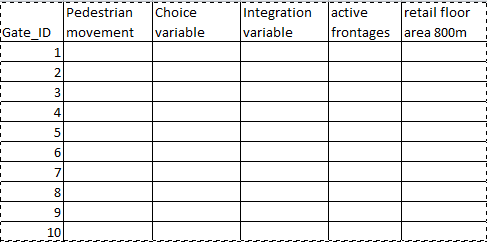
- The table should look like the following B
Simple Linear Regression
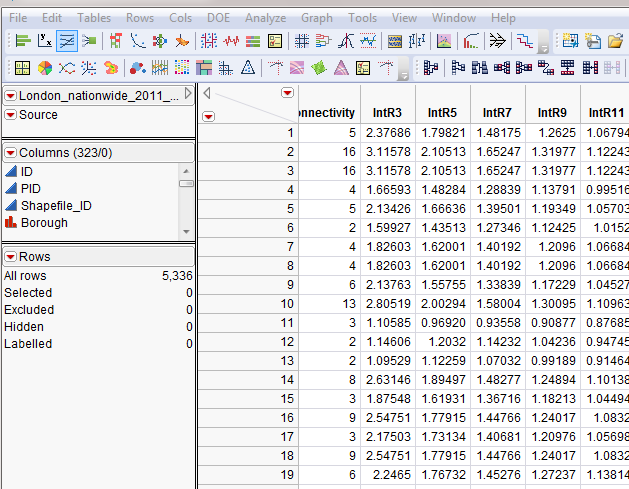
- Open csv in JMP : File -> open -> “segment.csv” C
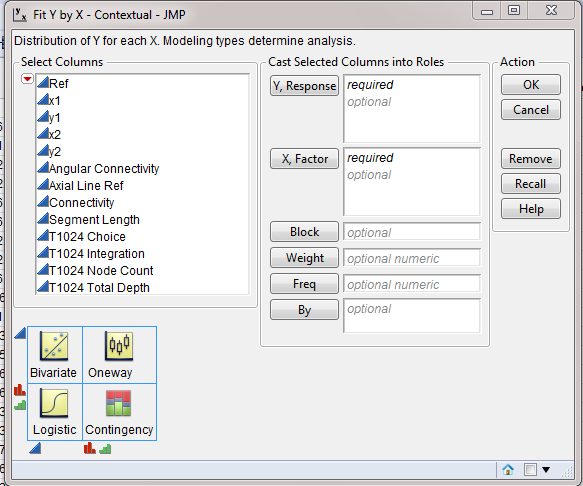
- Analyze -> Fit Y by X D
- Y,Response -> pedmov*
- X, Factor -> NAChRN
- Press OK
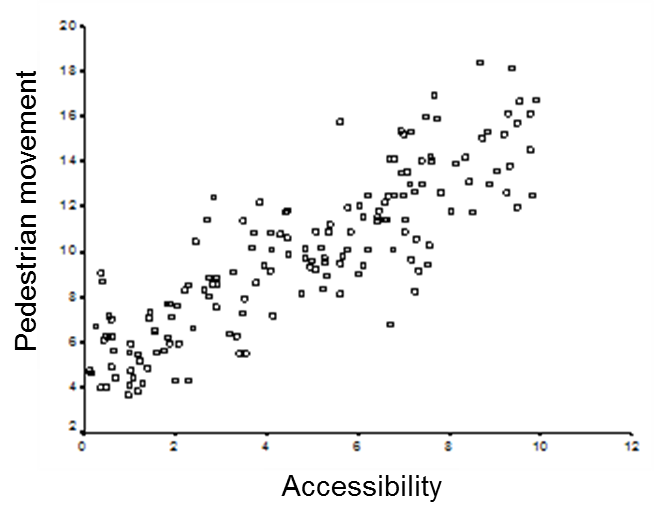
- This shows a scatterplot between the Y and X variables E
- Is association positive and linear, what does it mean?
- It is common in space syntax research to transform the pedestrian movement data by Logging both the dependent and independent variable. Log_pedmov= Log(pedmov + 2)
Multiple variable regression
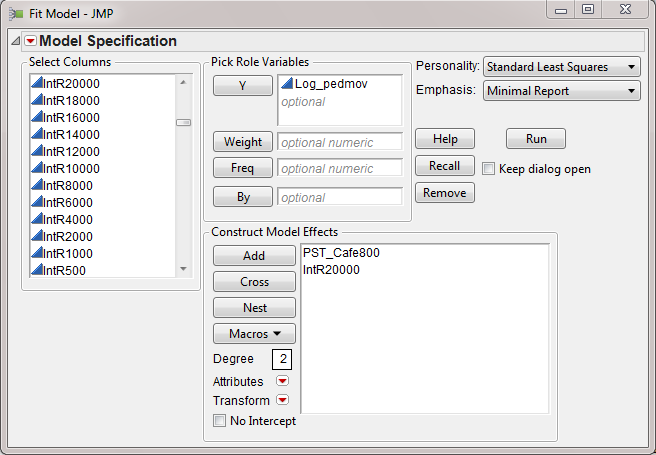
- analyse -> fit model
- Y -> set Log_pedmov F
- Construct Model effect -> add -> set spatial accessibility, transport, land use, urban design variables G
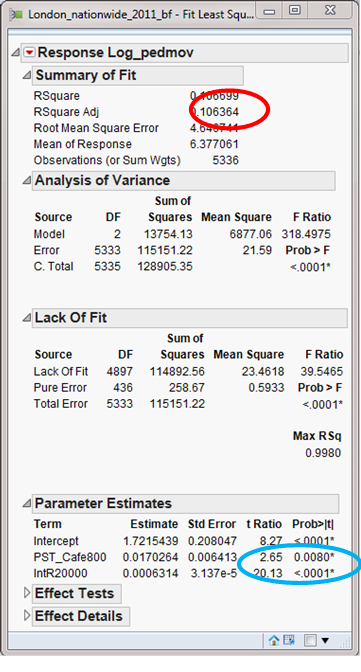
- Press Run -> results G
- Statistics inference (G blue circle) Remove variables that do not reach following threshold. Use as simplest a model as possible.
- R-square (0 – 1.0) : overall model explanation power.
If r2< 0.5, the model explanatory power is too low. - t-ratio > 2 or <-2 : threshold for significance
p-value < 0.01 : threshold for significance - save and interpret results (G red circle)
Press link for an animation of the steps.


