How are spatial relations measured and analysed?
A set of syntactic methods are applied to measure interior layout of a building, with regards to spatial configuration.
1. Convex map or J-graph analysis
One of the basic tools for analysing building layout is convex map analysis. Below is an example of how to create or undertake the analysis.
a. Construct graph
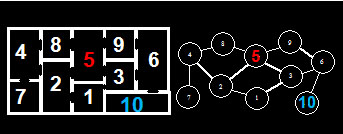
Convert a building layout into a graph (A) in which each node indicates a room and the links between them indicate doorways.
b. Step depth
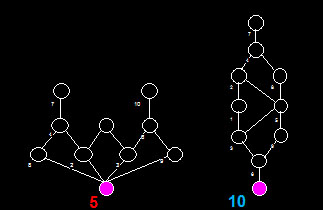
Step depth measures from the root space, the number of steps required to reach all the other rooms in the building. A Justified or J-graph is a representation of step depth from a particular room. For example, the J-graph of Room 5 (B) is shallower than Room 10.
c. Integration measure
Integration values can be then calculated according to the number of steps required to reach every other room in the system. The higher the integration, the fewer the steps required to traverse every room in the building.
d. Integration thematic (C)
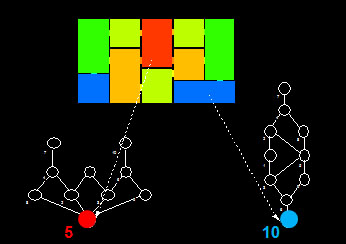
Colour up the layout according to integration values of the nodes, where red denotes more integrated rooms, and blue indicates more segregated rooms. This enables us to capture relationships between each room to all others.
2. Visibility Graph Analysis (VGA)
Visibility graph analysis (VGA) is a widely used technique to analyse spaces within a building. It is carried out as follows:
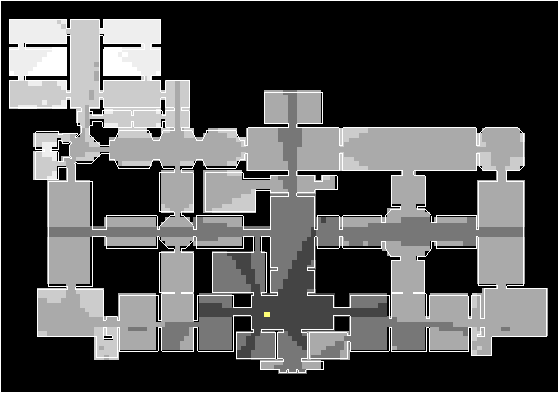
a. Construct a grid (A)
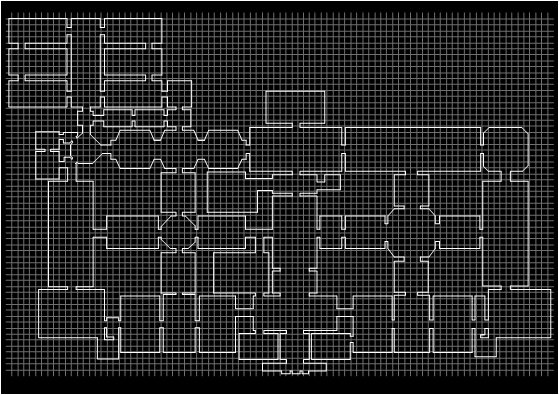
Make the point locations for analysis by overlaying a uniform grid above a building layout and filling the spaces we seek to analyse. The grid spacing controls the resolution of the analysis.
b. Create visibility graph
Draw isovists (B) from each cell to all the other cells and overlap them to construct a visibility graph.
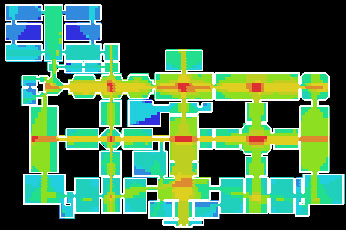
c. VGA Integration (C)
Create integration pattern of the layout by colouring up each point according to the integration values. The result shows how easy it is to see all the spaces within the layout from each point. For the procedure on generating a VGA integration pattern, see here.
Note: The VGA can be applied to two levels, eye level for what people can see, and knee level for how people can move which is critical in understanding spatial layouts.
See the tutorial for further information.
3. Agent Analysis
Visibility graphs can also be analysed through agent analysis, which studies movement patterns shaped by spatial configuration. An agent is an automata which navigate using visibility information available to them through the visibility graph. The analysis is conducted as follows (for detail, see here):
a. Create a visibility graph
Create the visibility graph as we do in the VGA;
b Run agent analysis
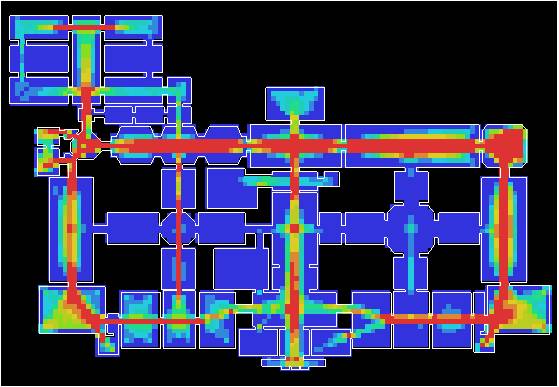
Select a location (or several locations) to release the agents and click ‘Run Agent Analysis’. For example, we release 50 agents near the entrance of the National Gallery. Agents can also be randomly released from any location in the grid.
c Agent trace pattern (A)
Visualise each cell of the grid by counting the number of times each agent traverses across it, where red indicates high density and blue indicates low density.
4. Others
Axial map analysis is also widely applied to the study of buildings. Please go to the glossary.


